


Get the latest insights from the Bright MLS T3 Home Demand Index and how to share them with your clients in this exclusive webinar event.
NEWS
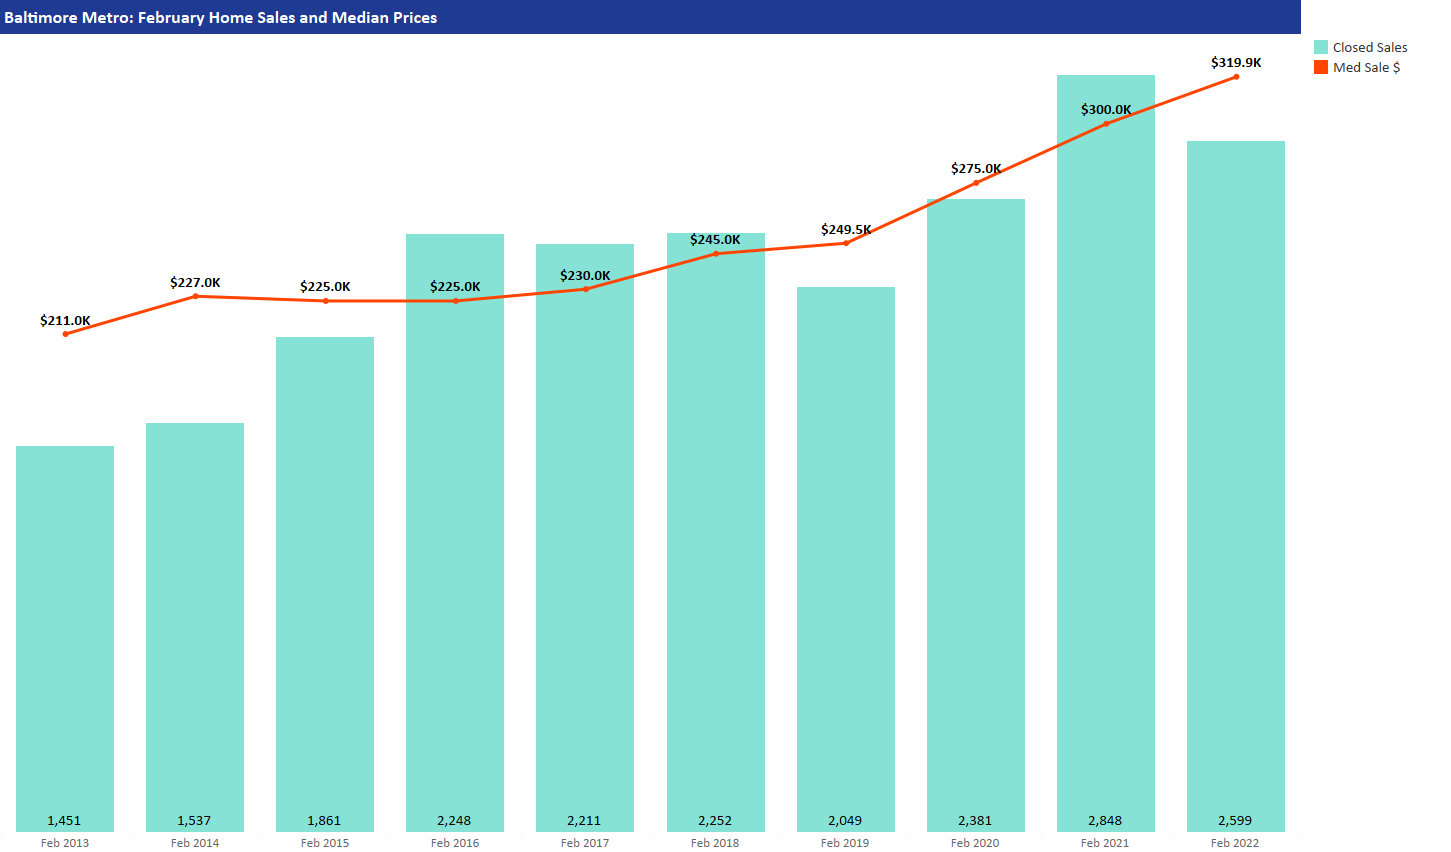
Lucky sellers? Prices continue to climb
Bright Insights, March 2022: While record low inventory continues to drive up prices, demand strengthened across the major metros in February.
Sales were not far off pre-pandemic levels, even as prices are still on the rise due to historically low supply levels.
Soaring prices have not impacted buyer demand across the major metros: sales last month were close to what they were in February 2020, and days on market are at February 2021 levels. These are encouraging signs for a busy spring market in 2022.
How did the market perform in February? Download the Monthly Market Reports:
| WASHINGTON D.C. METRO | BALTIMORE METRO | PHILADELPHIA METRO |
|---|---|---|
|
|
|
|
Home demand increased for each of the major metros in February, measuring in the Steady range.
Buyer interest rose for nearly all types of homes, with the strongest demand for higher-priced single-family homes and higher-priced condos.
Dive deeper into your market down to the ZIP code! Choose any area to view the Home Demand Index March 2022 Reports. For help using the map, watch our video.
WASHINGTON-D.C.-METRO |
BALTIMORE-METRO |
PHILADELPHIA-METRO |
Shareable resources
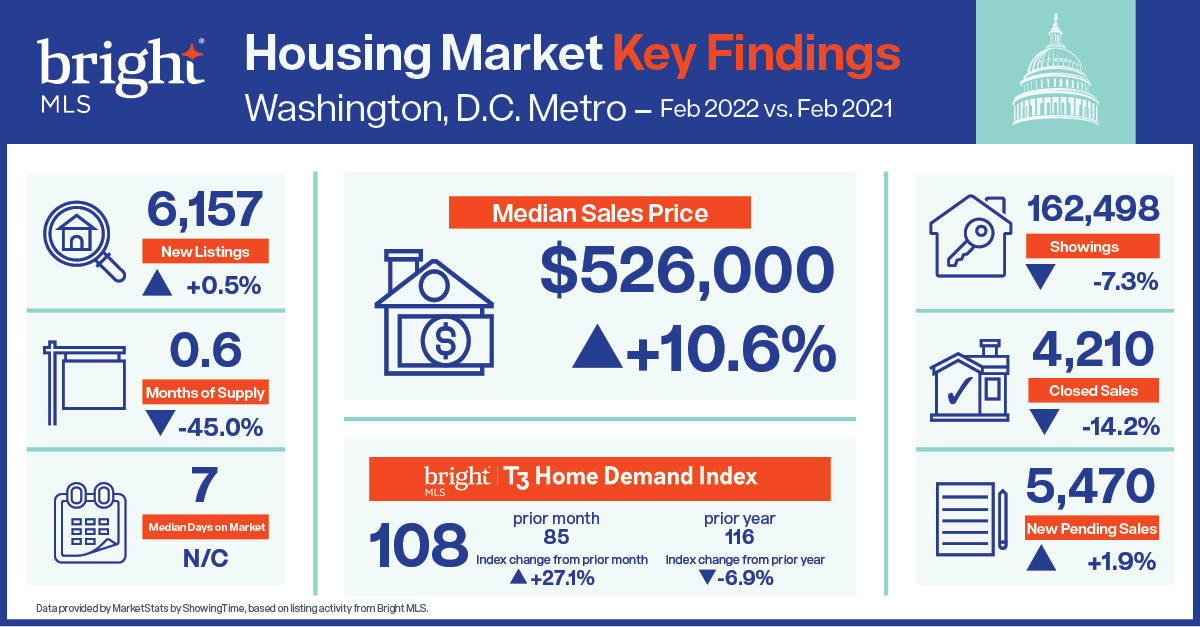
Key Findings - Washington, D.C.Download this graphic for the Washington D.C. Metro. |
 |
DOWNLOAD |
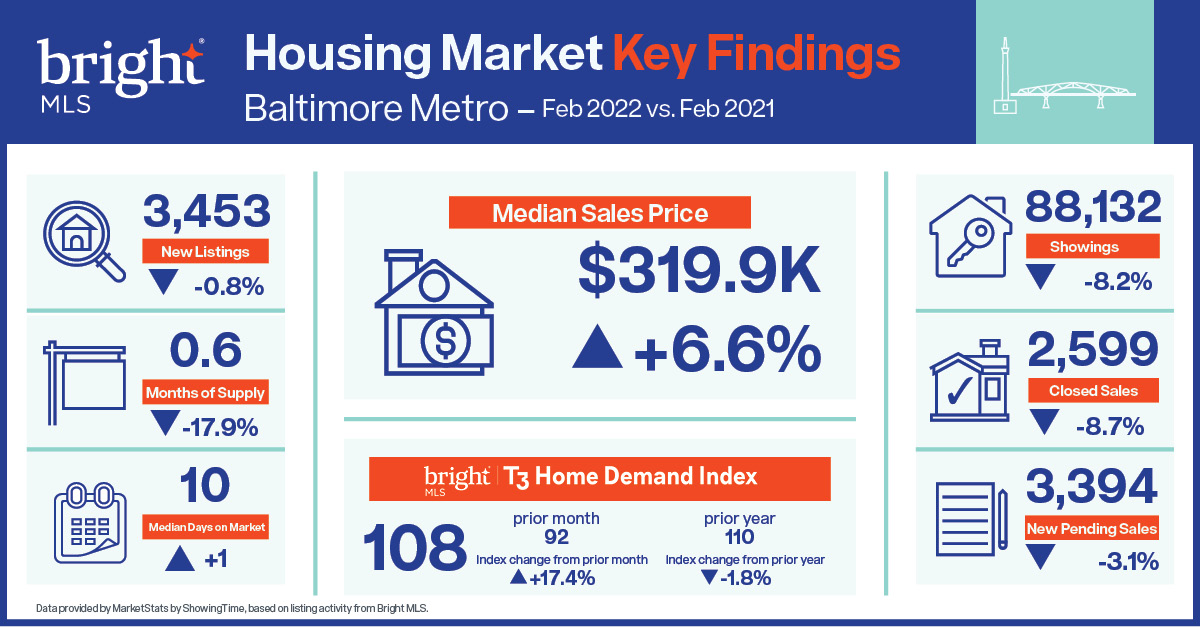
Key Findings - BaltimoreDownload this graphic for the Baltimore Metro. |
 |
DOWNLOAD |
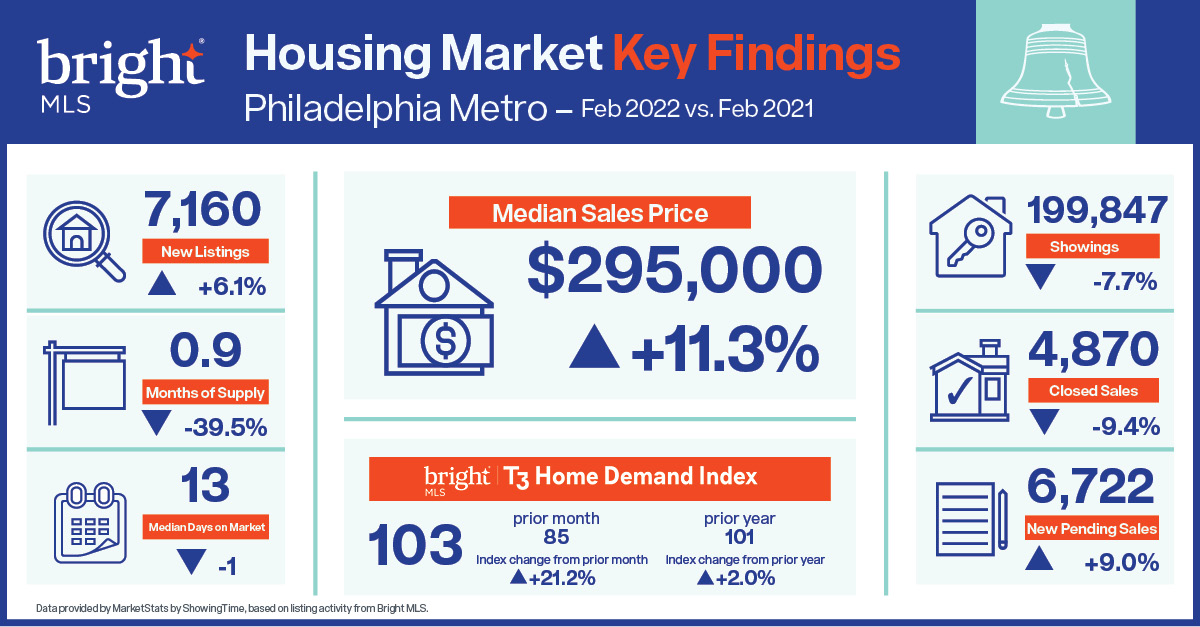
Key Findings - PhiladelphiaDownload this graphic for the Philadelphia Metro. |
 |
DOWNLOAD |
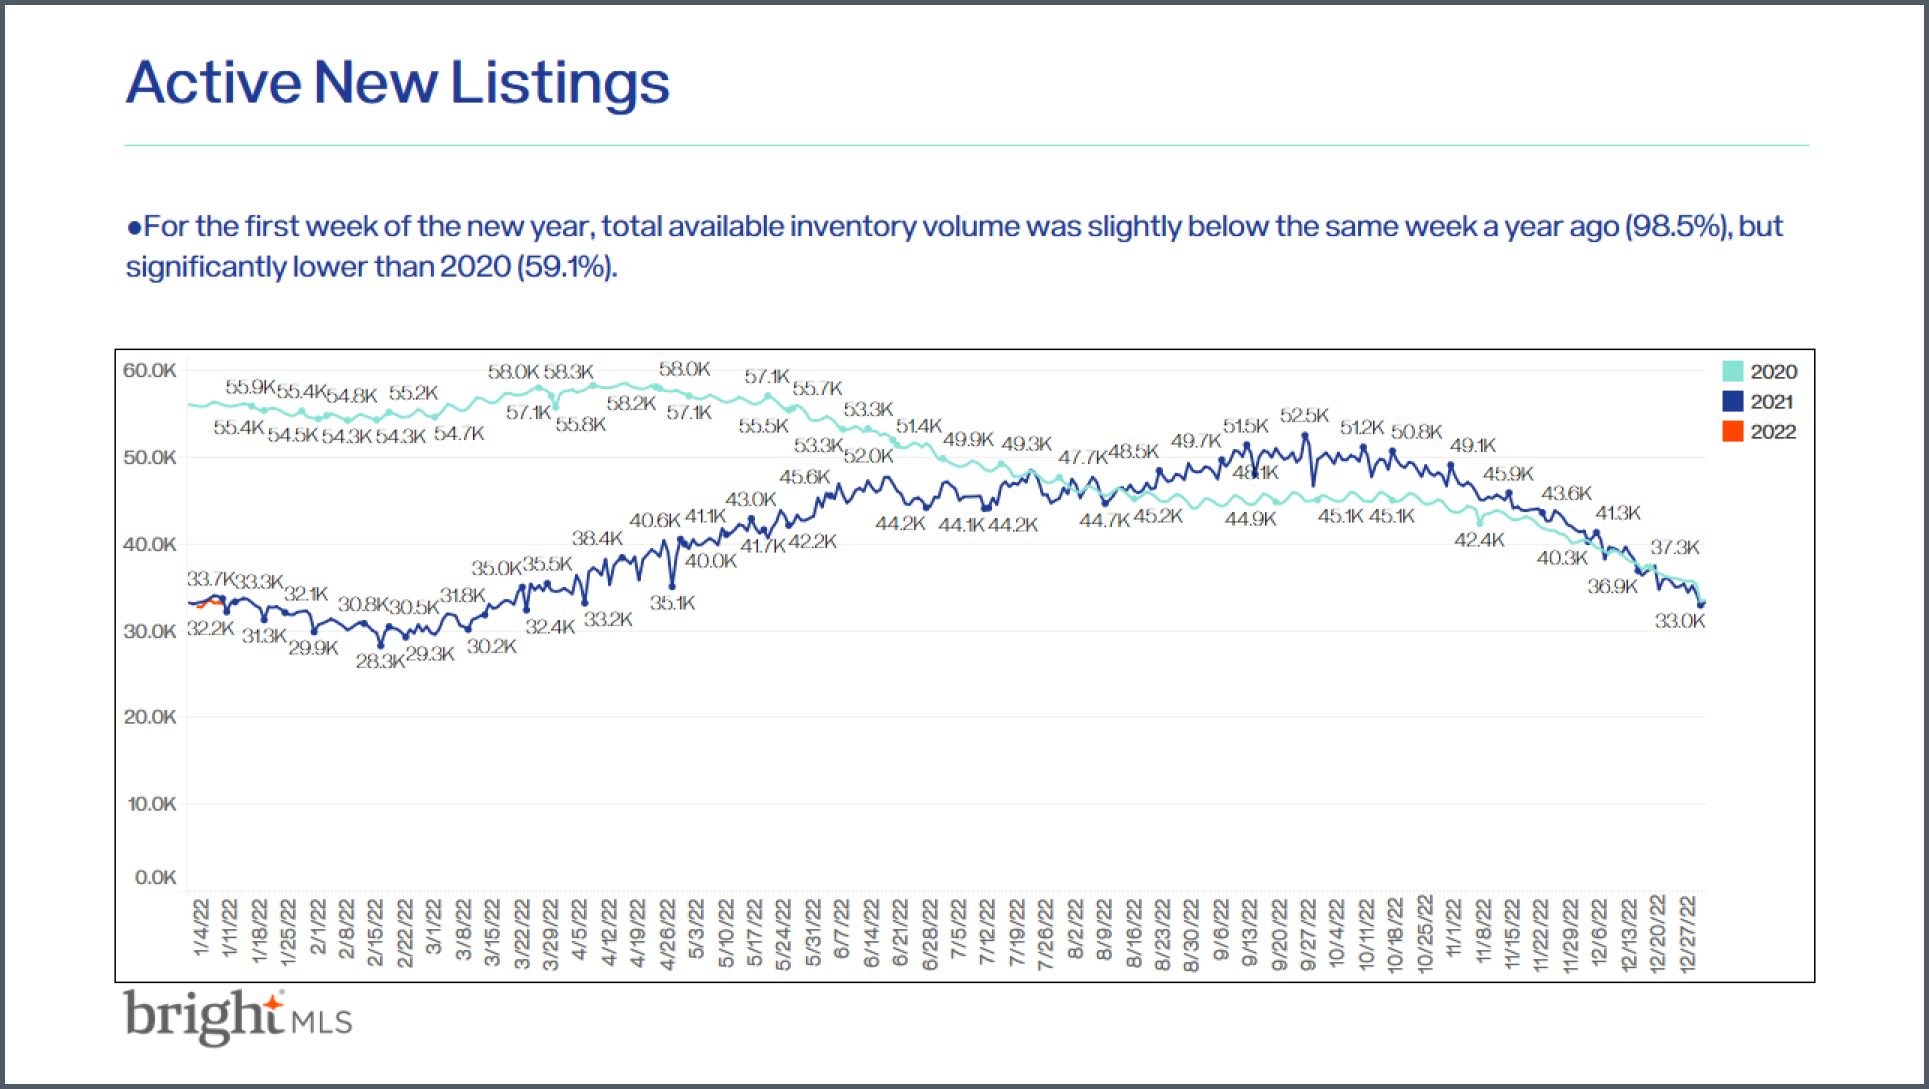
Weekly Market UpdateAccess these weekly reports for real-time data on residential market activity across the Bright footprint. |
 |
ACCESS NOW |
Want to see the statistics for your county?
Register for your free SmartCharts account to view monthly housing statistics for your county. And, if you want to dive even deeper, upgrade to SmartCharts Pro for zip code and school district-level statistics. Register today!
Learn more! Attend an upcoming webinar
Want to learn more about the Home Demand Index and how you can use it with your clients? Register for an upcoming webinar.
Recent articles
Bright Insights, February 2022: Home demand rose across the major metros in January, as the market saw more seasonal gains compared to last year’s records.
Back to Top