NEWS
November updates: Home Demand Index
New options for viewing current and past market trends are available in the Bright MLS T3 Home Demand Index.
Starting this November, you may notice some changes when viewing the Washington, D.C., Baltimore, and Philadelphia Metro reports in the Bright MLS T3 Home Demand Index.
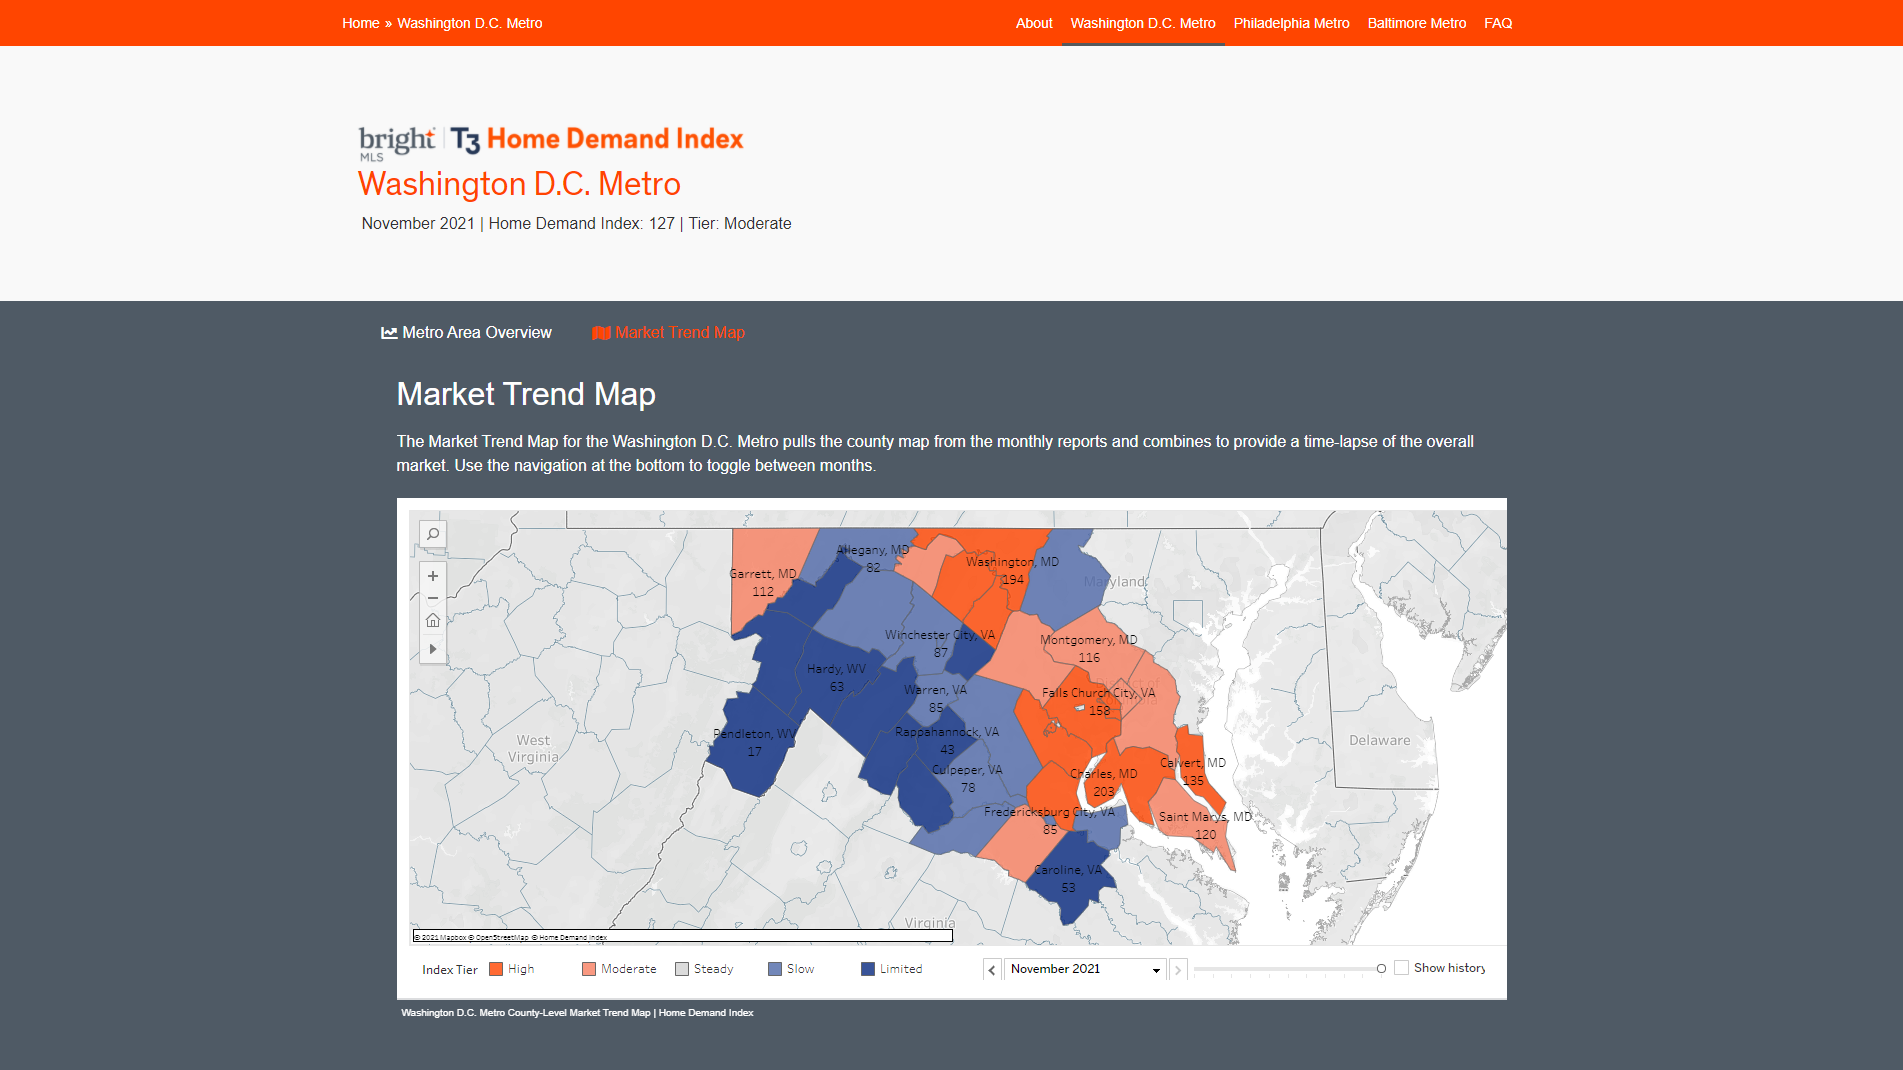
Using the links in the main navigation at the top right of the home page, each metro area now features a Metro Area Overview for viewing market trend lines at the major metropolitan area level, and a Market Trend Map for comparing past months at the county level.
Metro Area Overview:
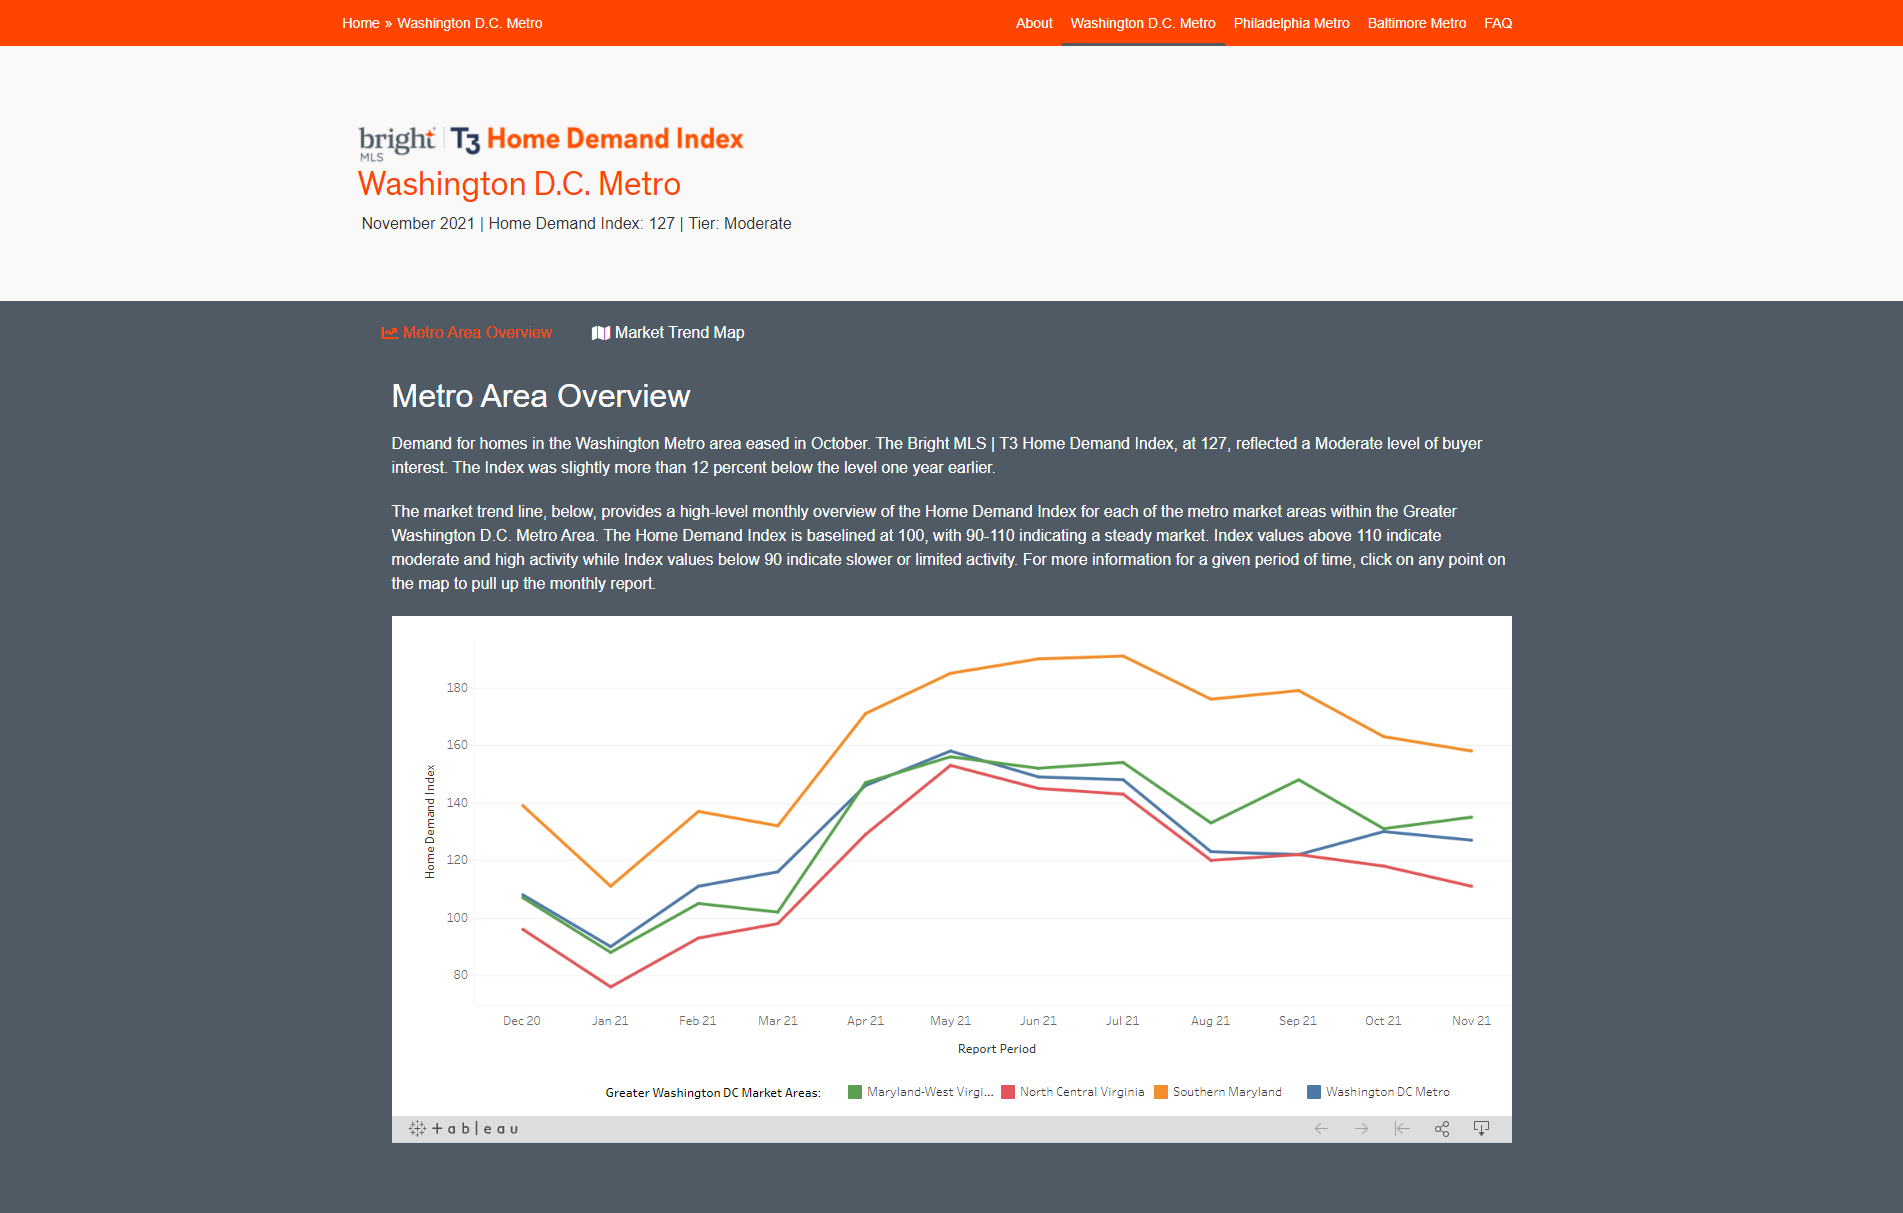
Click on any point on the Metro Area Overview to pull up the monthly report for a given period of time. On the Market Trend Map, use the navigation at the bottom of the map to toggle between months and view buyer demand based on county.
Market Trend Map:
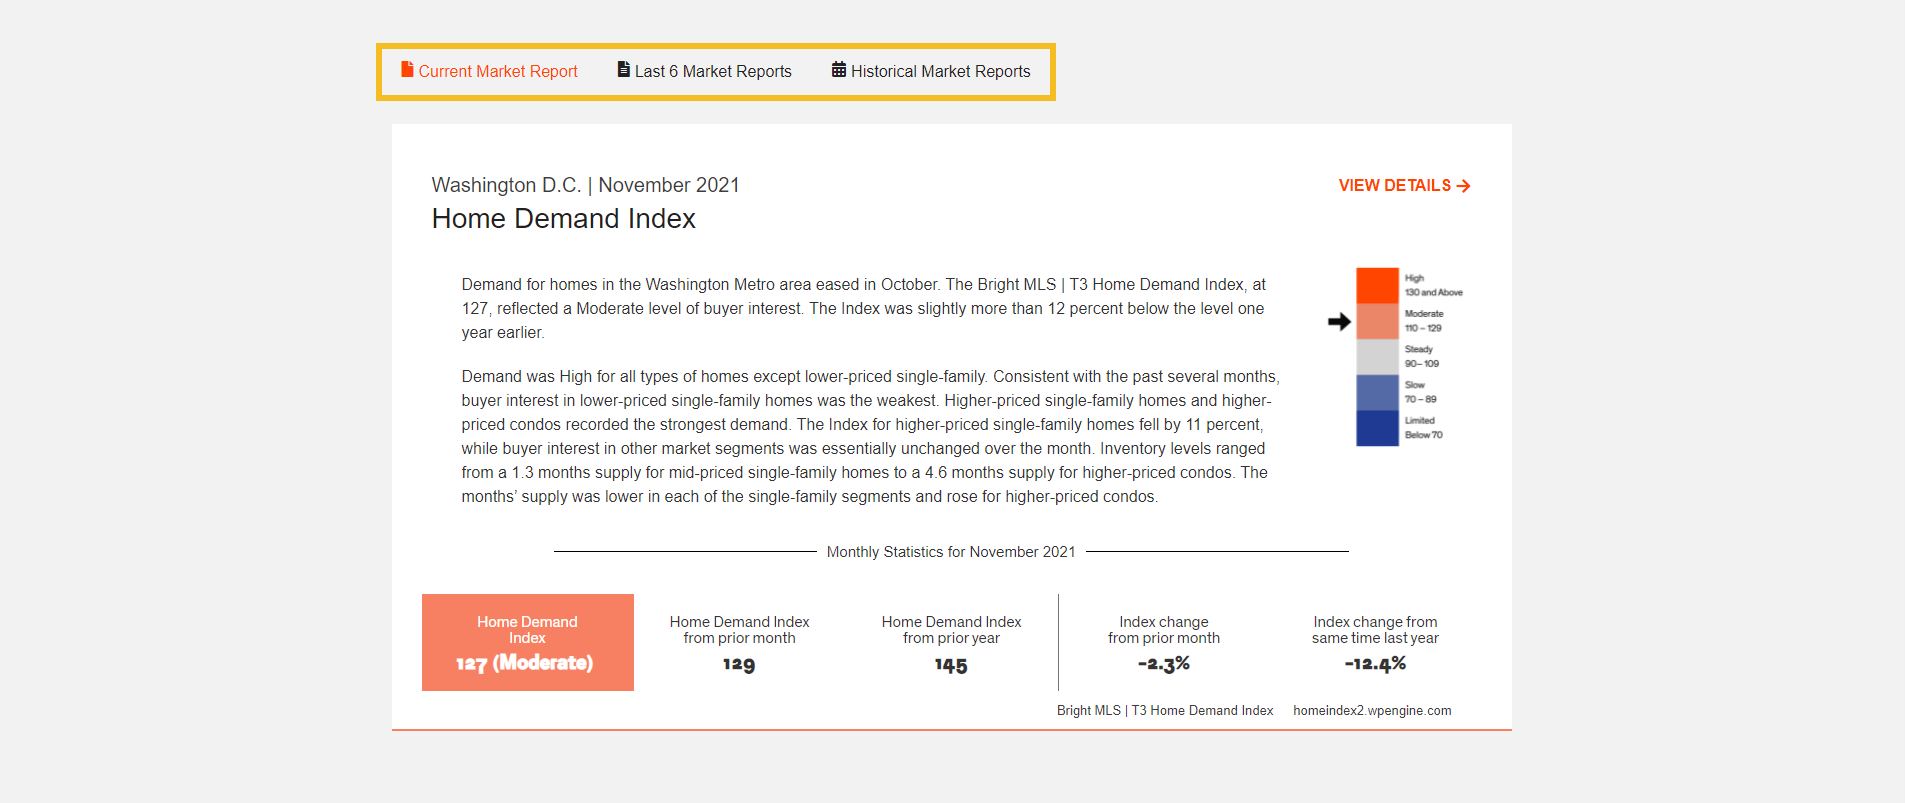
For each major metro area, there are also new options for selecting between the Current Market Report, Last 6 Market Reports, and Historical Market Reports above the main market report summary.
Market Report Options: