
Bright Insights, July 2022: The Mid-Atlantic is seeing slower activity as rising mortgage rates and high inflation have caused buyers to pull back.
NEWS
See Buyer Demand for Listings in Search
The Home Demand Index chart is now included on the Agent Full and 360 Search displays for listings.
When searching for listings, how helpful would it be to know the buyer demand for any listing’s area?
Now, you can easily tell for each listing in Search with the Bright MLS T3 Home Demand Index chart that is included on the Agent Full and 360 displays.
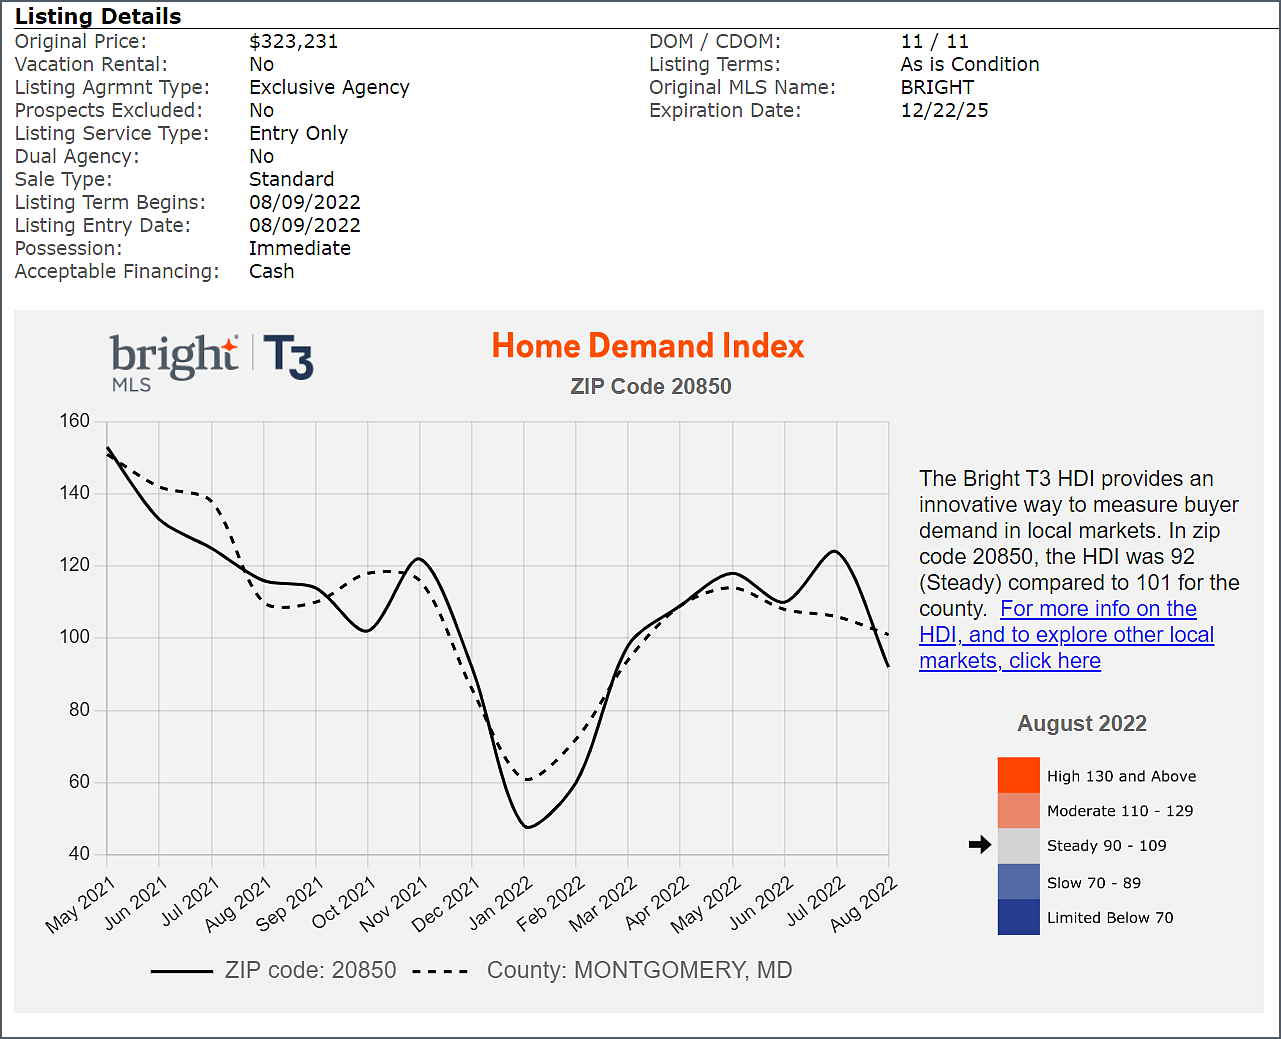
The Home Demand Index chart will give you a quick snapshot of the buyer demand for any listing’s zip code and county. If you want a more in-depth report, the chart also includes a link for you to review the latest Bright T3 Home Demand Index report for that listing’s market area.
Note: This chart is viewable only on the Agent Full and 360 search displays and will not show when you print these reports.
Want to learn how you can harness the power of Bright Search or hear where the housing market is headed in your area?
Attend an upcoming Bright Search webinar or sign up for one of our new monthly Housing Market update webinars for the areas where you work at BrightMLS.com/Education.
Get more with the Home Demand Index
For monthly statistics and real-time insights from the Bright MLS T3 Home Demand Index, please visit BrightMLS.com/MarketInsights.
Recent articles
We’ve added more classes to our Bright MLS educational series. Register now to get the latest tips and training!
Back to Top